
NJ property taxes skyrocketing — by as much as 33% in a year in one city
💰 The average property tax bill in New Jersey last year was $9,490
💰 Property taxes continue to be a driving factor in the state's unaffordability
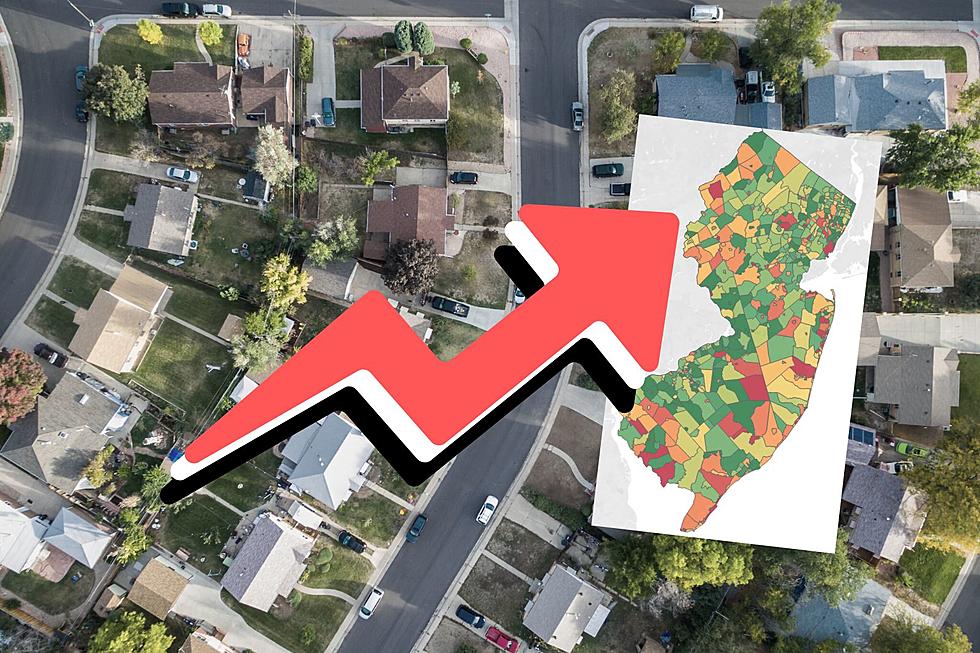
💰 See how your town compares in the lists and maps below
TRENTON — The cost of living keeps going up in the Garden State, driven in no small part by property taxes.
Last year, the average residential bill reached $9,490, up 2.1% from 2021, according to data released by the Department of Community Affairs.
But while tax bills might have inched upwards in some municipalities, it went through the roof in others.
In Jersey City, the average bill climbed a staggering 33% — several orders of magnitude more than what one might expect a "2% cap" might allow. The cap remains the law after more than a decade but it always allowed for a host of exceptions.
Top 20 property tax increases in 2022
These were the highest increases by percentage last year. The Top 20 are listed in ascending order with the share that each of the local governments is responsible for.
Union Beach Borough — Monmouth County
Average tax: $7,789 — Yearly change: 6.0%
County share: 11.1% | School share: 40.7% | Municipal share: 48.2%
Stone Harbor Borough — Cape May County
Average tax: $11,132 — Yearly change: 6.1%
County share: 50.1% | School share: 7.6% | Municipal share: 42.4%
Sea Isle City — Cape May County
Average tax: $5,528 — Yearly change: 6.3%
County share: 47.4% | School share: 4.7% | Municipal share: 47.9%
Pemberton Borough — Burlington County
Average tax: $4,657 — Yearly change: 6.4%
County share: 16.9% | School share: 54.7% | Municipal share: 28.4%
Toms River Township — Ocean County
Average tax: $7,178 — Yearly change: 6.5%
County share: 22.1% | School share: 50.% | Municipal share: 27.9%
Seaside Heights Borough — Ocean County
Average tax: $6,109 — Yearly change: 6.6%
County share: 17.9% | School share: 38.5% | Municipal share: 43.5%
Raritan Borough — Somerset County
Average tax: $8,910 — Yearly change: 6.6%
County share: 15.4% | School share: 59.8% | Municipal share: 24.8%
Neptune Township — Monmouth County
Average tax: $7,861 — Yearly change: 6.8%
County share: 12.4% | School share: 50.7% | Municipal share: 36.8%
Shiloh Borough — Cumberland County
Average tax: $5,217 — Yearly change: 7.0%
County share: 40.7% | School share: 49.7% | Municipal share: 9.6%
West Cape May Borough — Cape May County
Average tax: $6,469 — Yearly change: 7.2%
County share: 28.2% | School share: 41.6% | Municipal share: 30.1%
Keyport Borough — Monmouth County
Average tax: $8,039 — Yearly change: 7.2%
County share: 10.% | School share: 52.5% | Municipal share: 37.5%
West Long Branch Borough — Monmouth County
Average tax: $11,396 — Yearly change: 7.5%
County share: 14.% | School share: 52.6% | Municipal share: 33.4%
Stockton Borough — Hunterdon County
Average tax: $8,245 — Yearly change: 7.8%
County share: 17.5% | School share: 57.8% | Municipal share: 24.7%
Eatontown Borough — Monmouth County
Average tax: $9,259 — Yearly change: 8.1%
County share: 12.7% | School share: 51.9% | Municipal share: 35.4%
Asbury Park City — Monmouth County
Average tax: $7,048 — Yearly change: 9.7%
County share: 15.4% | School share: 39.5% | Municipal share: 45.1%
Surf City Borough — Ocean County
Average tax: $8,632 — Yearly change: 10.0%
County share: 41.4% | School share: 34.2% | Municipal share: 24.4%
Cape May Point Borough — Cape May County
Average tax: $5,044 — Yearly change: 10.1%
County share: 50.2% | School share: 3.1% | Municipal share: 46.7%
Blairstown Township — Warren County
Average tax: $8,425 — Yearly change: 10.3%
County share: 26.9% | School share: 63.3% | Municipal share: 9.8%
Shrewsbury Township — Monmouth County
Average tax: $4,720 — Yearly change: 12.7%
County share: 9.8% | School share: 38.2% | Municipal share: 52.%
Jersey City — Hudson County
Average tax: $9,853 — Yearly change: 33.0%
County share: 20.5% | School share: 40.8% | Municipal share: 38.7%
More spending, less aid drives up taxes
In Jersey City, the local tax levies for the school district and for City Hall each increased by 50%, totaling $353.81 million for the schools and $335.71 million for the municipality.
The school tax levy was the result of a more expensive budget coupled with diminishing state aid, which once greatly benefited Jersey City as a result of a state Supreme Court ruling that mandated funding for the state's 31 poorest districts. In recent years, however, the state's second largest city has lost hundreds of millions of dollars in aid. And the bleeding might continue next year, as Gov. Phil Murphy's proposed budget includes a 28% reduction to the city's school aid.
The average property tax bill increased in 493 municipalities last year.
The number of municipalities where the average tax is at least $10,000 a year rose to 212.
Up or down? Average property tax changes in NJ in 2022
Gallery Credit: Sergio Bichao/Townsquare Media
Sergio Bichao is the digital managing editor for New Jersey 101.5. You can reach him at sergio.bichao@townsquaremedia.com
Click here to contact an editor about feedback or a correction for this story.
More From New Jersey 101.5 FM


