
NJ election in March: 11 districts voting on $520M in new school spending
🍎 Voters in 11 school districts are headed to the polls for a special election Tuesday
🍎 They will decide on more than $520 million in new spending
🍎 The state will cover 40 percent of the projects through debt service aid
Voters in 11 school districts throughout New Jersey headed to the polls are being asked if they want to approve over $520.6 million in new spending for construction projects.
The special election on Tuesday gives each district control over its own proposed spending. Most of the proposals mention renovations, additions, and various upgrades.
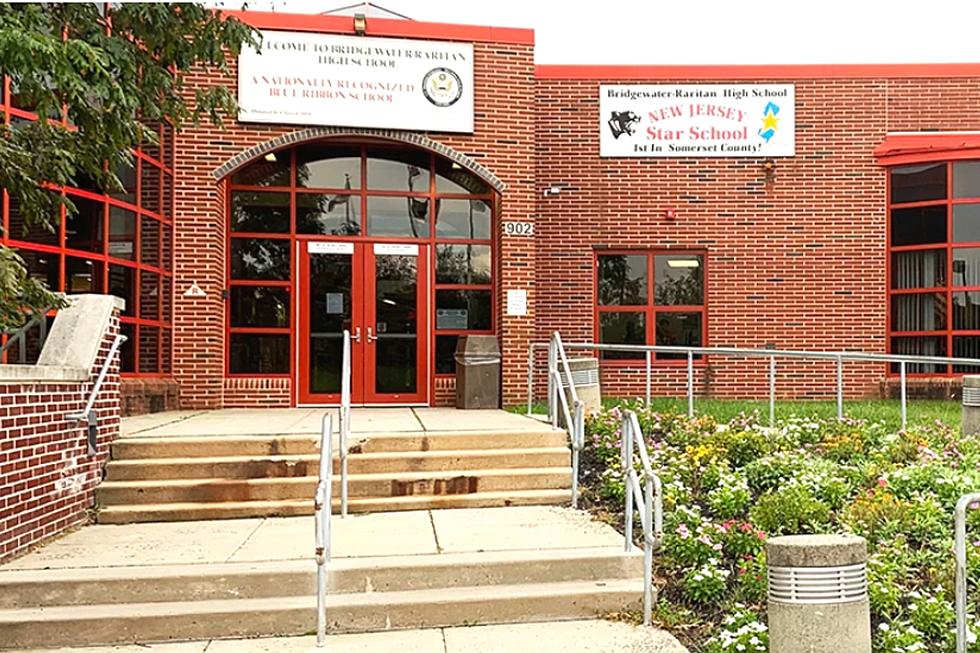
More expensive projects include Hillsdale ($82M) which is looking to build a new middle school, Monroe in Middlesex County ($103M) which is planning additions to its high school, middle school, and Applegarth Elementary, and Bridgewater-Raritan ($155M) which would use its funds for sweeping infrastructure improvements and facilities for a full-day kindergarten program.

The school districts of Bogota, Birdgewater-Raritan, and Springfield in Union County have two ballot questions. The second questions are conditional on the approval of their first questions; in a situation where a second ballot question is approved but not the first, neither would be approved.
The spending proposals for each district are listed below:
🍎 Bogota: Question 1 — $12,720,621, Question 2 — $7,233,406
🍎 Hillsdale: $82,724,265
🍎 Maywood: $22,060,140
🍎 Saddle Brook: $14,441,787
🍎 Monroe (Middlesex): $103,627,203
🍎 Woodbridge: $32,348,471
🍎 Morris Plains: $9,498,051
🍎 Riverdale: $18,921,796
🍎 Washington Township (Morris): $28,809,494
🍎 Bridgewater-Raritan: Question 1 — $120,580,869, Question 2 — $34,783,460
🍎 Springfield (Union): Question 1 — $18,878,356, Question 2 — $13,994,508
The state will fund at least 40% of construction costs through annual debt service aid, according to the New Jersey School Boards Association. Other costs will be addressed through additional taxes or levies, depending on the district.
Up or down? Average property tax changes in NJ in 2022
Gallery Credit: Sergio Bichao/Townsquare Media
Rick Rickman is a reporter for New Jersey 101.5. You can reach him at richard.rickman@townsquaremedia.com
Click here to contact an editor about feedback or a correction for this story.
The most Irish towns in New Jersey
Gallery Credit: Sergio Bichao/Townsquare Media NJ
More From New Jersey 101.5 FM


