Looking for work? New Jersey is the 4th best state to get a job
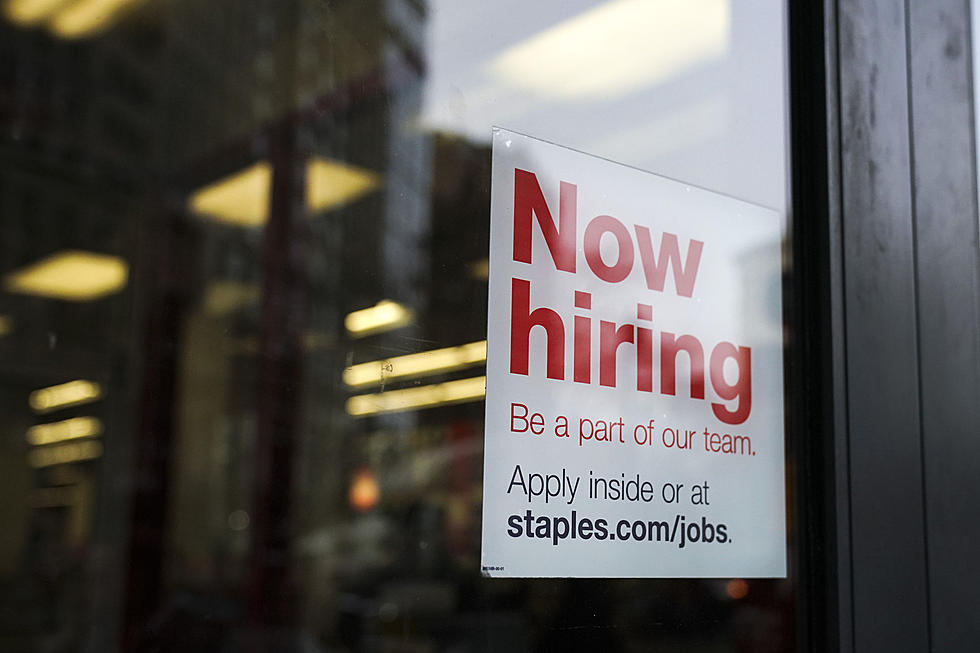
There are so many people out of work across the country, it's good to know that you can get a job in New Jersey much easier than in most other states.
With the labor force participation rate at 62.1%, one of the lowest rates in decades, WalletHub today released updated data on 2022’s States Where Employers Are Struggling the Most. If you scroll down, and farther down, and even farther down than that you'll see that New Jersey comes in at 48 making us the 4th best state to get a job in.
Some New Jersey Hiring struggle stats:
Job openings rate during the latest month: 5.70%
Job openings rate in the past 12 months: 6.10%
Overall rank: 4th smallest hiring struggle in the country.
The three places that came in lower than New Jersey were Connecticut, Washington, D.C., and New York.
You would figure it easier to get a job in New Jersey since we have so much diversity of offer in the workforce. No matter what you want to do or which career you've chosen, you can pretty much find it here.
If you're looking for work in New Jersey the companies that are employing the most workers so far in 2022 are:
Amazon with about 50,000 employees in New Jersey.
Wakefern Food Corp, which we know as Shop Rite with 36,409 employees.
Walmart with 23,799 employees in New Jersey.
UPS with 19,826 employees.
Johnson and Johnson headquartered in New Brunswick they have about 15,900 employees in New Jersey.
The states where employees are struggling the most are Alaska, Georgia, Montana, Louisiana and New Mexico.
Opinions expressed in the post above are those of New Jersey 101.5 talk show host Steve Trevelise only. Follow him on Twitter @realstevetrev.
You can now listen to Steve Trevelise — On Demand! Discover more about New Jersey’s personalities and what makes the Garden State interesting . Download the Steve Trevelise show wherever you get podcasts, on our free app, or listen right now.
Click here to contact an editor about feedback or a correction for this story.
LOOK: See how much gasoline cost the year you started driving
Top 200 '70s Songs
More From New Jersey 101.5 FM


